Environment
 |
 |
 |
 |
 |
 |
 |
‘No Global Warming for 16 Years’ - Part II
Skewing Data to Favor Global Warming
Answer: ... Alteration of scientific conclusions: The final scientific draft of the IPCC’s 1995 Third Assessment Report, submitted by hundreds of participating scientists, had concluded five times that no manmade warming influence is yet discernible:
- “None of the studies cited above has shown clear evidence that we can attribute the observed changes to the specific cause of increases in greenhouse gases.”
- “No study to date has positively attributed all or part [of observed climate change] to anthropogenic causes.”
- “While none of these studies has specifically considered the attribution issue, they often draw some attribution conclusions for which there is little justification.”
- “Any claims of positive detection of significant climate change are likely to remain controversial until uncertainties in the total natural variability of the climate system are reduced.”
- “When will an anthropogenic effect on climate change be identified? It is not surprising that the best answer to this question is, ‘We do not know.’”
"The body of evidence now points to a discernible human influence on global climate."
However, the “body of evidence” in the temperature record showed no such thing.
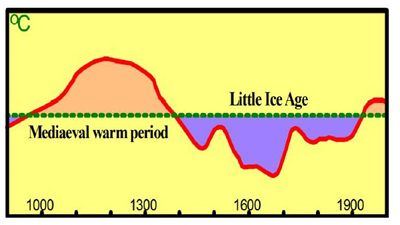
Wilful data manipulation: The IPCC decided in its 2001 report to depart from its 1990 First Assessment Report, which had shown a schematic indicating that the mediaeval warm period had been appreciably warmer than the present.

A graph showing a mediaeval warm period
In 1995, Dr. David Deming had written a paper in Science on the reconstruction of pre-instrumental surface temperatures by borehole measurements. As a result, he was congratulated by several scientists. In 2005 he wrote:
“A major person working in the area of climate change and global warming sent me an astonishing email that said, ‘We have to get rid of the Mediaeval Warm Period.’”
Not “We have to verify the extent and duration of the Mediaeval Warm Period” – that would have been a scientific statement. Instead, “We have to get rid of the Mediaeval Warm Period” – a political statement. And that is exactly what was done.

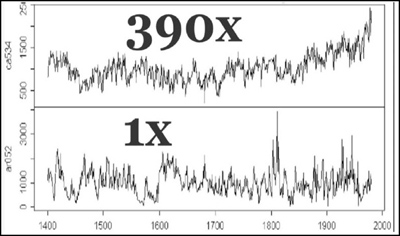
The IPCC’s 2001 Fourth Assessment Report reproduced six times, in full color, a graph that relied upon a number of unorthodox statistical practices. The paper, (Mann et al., 1998-1999), drew heavily upon bristlecone-pine proxies for pre-instrumental temperature change, even though a previous IPCC report had recommended against the use of such proxies on the ground that the width of the tree-rings is influenced not only by temperature change but also by changes in precipitation, and most notably by changes in atmospheric CO2 concentration.
Recent attempts by Mann and others to revive the unsound graph suffer from some of the same defects as the original: removing the bristlecone proxies and a further defective outlier (the Tiljander proxy) from among the proxy datasets clearly shows that the medieval warm period was real, was global, and was appreciably warmer than the present.
Dr. Craig Idso has collected papers by almost 1,000 scientists worldwide, nearly all of which demonstrate the influence of the Mediaeval Warm Period and show that it was at least as warm as, and in most instances warmer than, the present. If the IPCC were to do science by consensus, it would probably not give credence to model-derived results contradicting the consensus.
The statistical methods in Mann et al. were examined by McIntyre & McKitrick (2003, 2005). In all material respects, the two researchers’ findings were powerfully endorsed by a detailed investigative study by three statisticians at the instigation of the House (Wegman, 2005).
Among other conclusions, the Wegman report found that a sudden and suspicious spate of papers published after the exposure of the defects in the paper that purported to abolish the Mediaeval Warm Period, all of which used similar methods and came to similar results, had been published by authors associated with the lead author of the original paper via previous joint publication.
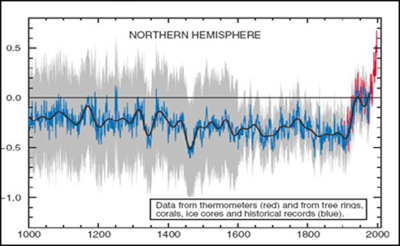
The content of the Climategate emails, when they emerged in 2009, was sufficiently disturbing to prompt the Attorney General of the State of Virginia to initiate an investigation of the circumstances surrounding the compilation and publication of what was to become known as the “hockey-stick” graph (with a straight shank showing no Medieval Warm Period and a long blade suggesting a rate of increase in global temperature, and an absolute global temperature, that are unprecedented in the past millennium. It was the hockey-stick graph that wrongly wiped out the Mediaeval Warm Period.
The legislative basis for the Attorney General’s investigation is the Fraud against Taxpayers Act. The question he is asking is this: Did those who compiled the hockey-stick graph knowingly fabricate data or falsify results in a manner calculated to defraud taxpayers by attracting research grants?
It is not for me to say whether any of those responsible for the hockey-stick had committed criminal offences. However, it is worth examining some of the scientific criticisms of the graph that have emerged. These criticisms reveal multiple techniques that appear to have been calculated artificially to deliver the result desired by the climate extremists.

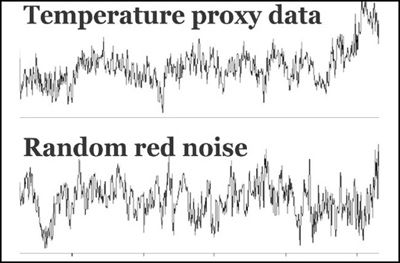
Overriding the data by programming: The Mann-Bradley-Hughes algorithm always produced hockey-stick-shaped graphs showing exaggerated and exceptional 20th-century warming, even if proper temperature proxy data (from tree-rings, stalagmites, lake sediments, etc.), were replaced with red noise, a type of entirely random input data. The computer program had been tuned so that it very nearly always produced graphs of the shape the authors produced (see graph below right).

To be continued

Posted October 28, 2013
______________________
______________________


